Jul 9, 2021 5:37:11 PM
Retail | Operations


The pandemic forced retailers to cut down, strip back and spend less, but the one thing they have in abundance is access to huge realms of data.
In ecommerce, retailers are using data to celebrate customer birthdays, suggest products that are in-line with a customer’s personal style and needs, price strategically and offer discounts at the optimal moment. McKinsey explains that winning retailers are collecting real-time data to create ‘a new agile operating model to harness these insights and put them into action’.
Physical stores also have access to a huge range of data which can be used to enhance the customer experience and drive sales. But for stores to be able to do this, retailers need to know how to use the data they have.
A survey commissioned by Deloitte found that retailers aren’t managing this.
On average, the retailers surveyed used 17 different applications for collecting customer data and only 38% of companies strongly agree they know where all relevant data is stored. To make the most of the sea of data available, retailers need to not only be collecting and analysing data, but also correlating different data sources with each other to see the full picture of how in-store activity leads customers to a sale.
Sales data is everything, but retailers need to know what factors optimize customer experience and create the best environments for sales to happen, particularly when many aspects of a store are managed remotely.
Related: How to Manage Store Operations Remotely
Operational data enables retailers to analyze in-store activity to establish which elements of processes and task management are the most valuable for the business.
Operational data includes:
Compliance data allows a retailer to see whether or not each store in the network has complied with procedures and completed required forms, checklists and tasks.
This data enables retailers to measure how long it takes each store to complete various tasks and processes and implement any feedback.
Training data shows which training courses have been completed by each store team along with any scoring data and how soon they completed the training after it was made available.
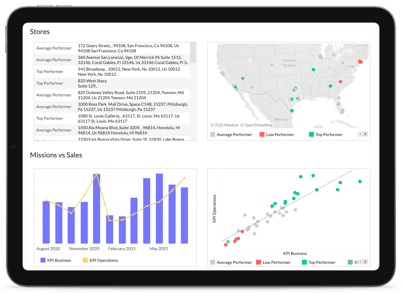
Operational data is best utilized by comparing it with the sales data from each store. Sales data includes:
Correlating operational and sales data has 3 main benefits:
Looking at operations and sales data for each store side by side helps you make sure that store communications, guidelines, tasks and processes are actually driving sales. Retailers can pick up on correlations between certain processes and analyze how they influence sales.
For example, if a retailer decides to do a flash sale on a particular product, they need to know whether the marketing materials displayed in the store impact how many of the product are sold. Tracking relevant sales data for the product in each store and comparing it to the compliance rate for displaying the marketing materials allows HQ to see how impactful the materials are. If compliant stores did not make significantly more sales than non-compliant stores, then it’s possible that the marketing materials are ineffective and may need to be re-worked.
Real agility requires real-time data. Immediately being able to recognize patterns between sales data and operations data allows retailers to quickly make changes to processes when they’re not working, so weaknesses are resolved faster.
For example, if a grocery store can see that a store is making lower sales of fresh vegetables than other stores in the area and they have also not completed a to-do to apply discount labels to products which are soon to expire, they can send a reminder to stores to make the task a priority.
Additionally, if a fashion retailer notices that a store has a lower average basket size than other stores, HQ can send a notification to the lower performing store team to complete a training course on up-selling.
Classifying top and low performing stores according to sales and operations data gives regional teams the tools to prioritize and plan. Comparing sales and operational data gives retailers the freedom to tactically adjust the levers of different operational components like visual merchandising, daily checklists, cleaning and maintenance tasks and product recalls to create the perfect formula to drive sales.
For example, a retailer might notice a trend that underperforming stores are also taking longer to complete daily tasks. Spending longer on tasks means that store teams are spending less time with customers, so this information would enable a regional manager to work with the struggling store to find ways to make tasks more efficient.
Alternatively, a retailer might notice that high performing stores are faster to replenish stock, so could replicate this in other stores by making this task a higher priority on the to-do list.
Without the ability to make these connections, it’s impossible to know how to help struggling stores improve and replicate the successes of high performing stores across the network.
To use both sales and operations data to see what works and what doesn’t, make changes in real-time and find patterns to give stores the support they need, retailers need the right tech.
Specifically, a tech that:
Having the data is just step one. It’s the actions you take with it that make the magic happen.
--
Not only does YOOBIC’s digital workplace give store teams everything they need to grow sales by streamlining store operations - it also helps regional and HQ teams understand what drives those sales and how to turn every store into a top performer.
Customizable, intuitive dashboards give busy teams the power to deep dive into data, create action plans that actually drive results and make the whole organization more agile.
See how it works for yourself!

Popular Posts
Connect with Us